
Graphic: NASA Earth Observatory
For decades, we have more detailed maps of the Moon’s surface than Earth’s ocean floor. Although ships equipped with sonar can capture highly detailed images of the seafloor, only about 25 percent of the ocean has been mapped this way. Scientists have long been working to do better.
Now, a NASA-supported research team has taken a major step forward by creating one of the most detailed maps of the seafloor to date, using data from the SWOT (Surface Water and Ocean Topography) satellite.
One of the most striking discoveries made through the SWOT satellite’s observations is the discovery of nearly 100,000 seamounts beneath the ocean’s surface.
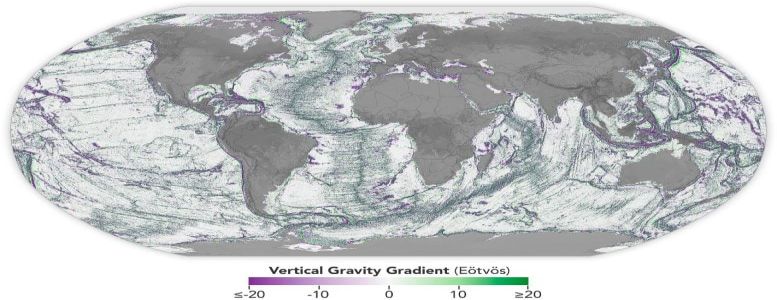
Because geologic features like seamounts and abyssal hills deep beneath the ocean’s surface have more mass than their surroundings, they exert a slightly stronger gravitational pull that creates small, measurable bumps in the sea surface above them. These subtle gravity signatures help researchers predict the kind of seafloor feature that produced them.
In a collaboration between NASA and the French space agency CNES (Centre National d’Études Spatiales), scientists have used data from the SWOT satellite wide-swath radar altimetry to measure tiny differences in sea surface height, revealing features on the ocean floor.
SWOT covers about 90 percent of the globe every 21 days. Through repeated observations, the satellite is sensitive enough to pick up these minute differences, with centimeter-level accuracy, in sea surface height caused by the features below. David Sandwell, a geophysicist at Scripps Institution of Oceanography, and his colleagues used a year’s worth of SWOT data to focus on seamounts, abyssal hills, and underwater continental margins, where continental crust meets oceanic crust.
Previous ocean-observing satellites have detected massive versions of these bottom features, such as seamounts over roughly 1 kilometer (3,300 feet) tall. The SWOT satellite can pick up seamounts less than half that height, potentially increasing the number of known seamounts from 44,000 to 100,000. These underwater mountains stick up into the water, influencing deep sea currents. This can concentrate nutrients along their slopes, attracting organisms and creating oases on what would otherwise be barren patches of seafloor.
“The SWOT satellite was a huge jump in our ability to map the seafloor,” Sandwell said. Sandwell has used satellite data to chart the bottom of the ocean since the 1990s and was one of the researchers responsible for the SWOT-based seafloor map, which was published in the journal Science in December 2024.
NASA believes that SWOT will revolutionize oceanography by detecting ocean features with 10 times better resolution than present technologies. Such small-scale ocean features contribute to the ocean-atmosphere exchange of heat and carbon, major components in global climate change. Moreover, SWOT’s detailed information on ocean circulation will improve understanding of the ocean environment including the motion of life-sustaining nutrients and harmful pollutants.
Thanks to Alaric Bond for contributing to this post.
NASA Maps Earth’s Ocean Floors from Space in Stunning Detail