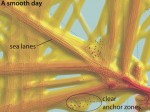
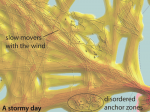
From New Scientist: As new ways of analysing the world around us are developed, new ways to visualise that information are needed. At the recent Eurographics Symposium, held in Berlin, traffic in shipping traffic near Rotterdam was mapped on both calm and rough weather days.
On a rough day it is clear that the shipping lanes have broken down, and that shipping density doesn’t get so high. The slow-moving vessels produce darker, more defined trails. Click the images below for larger images:
The new visualisation method was developed by Niels Willems at Eindhoven University of Technology, the Netherlands, with colleagues Huub van de Wetering, and Jack van Wijk.


